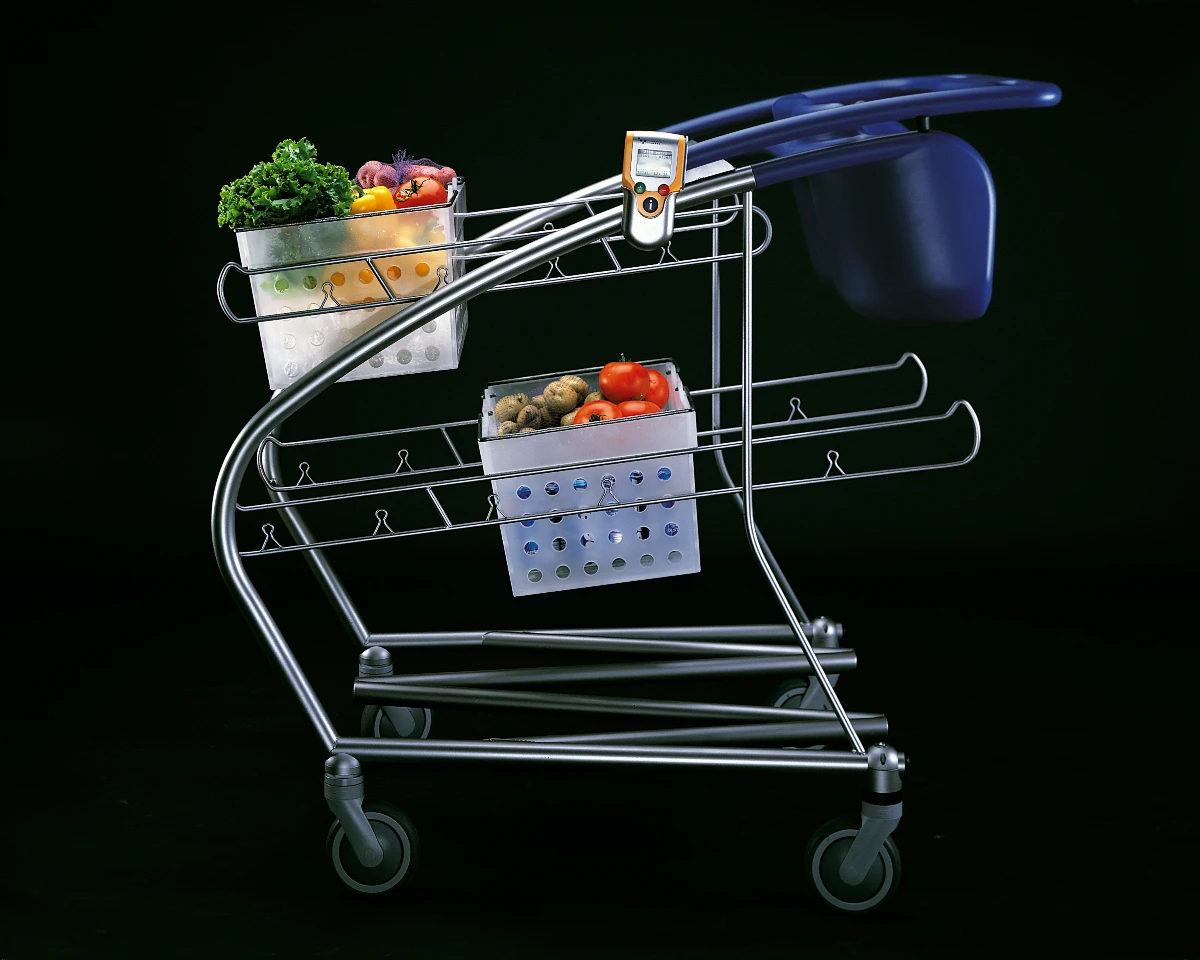
IDEO's Shopping Cart
A supermarket cart redesign that demonstrates UCD throughout
Read spotlight →Guiding questionHow do designers understand the relationship between users, the product and the environment?
User-centered research and design (see topic B1.1) are the foundation of this course. They may change the way you think about all the stuff around you, and they will help enormously with part A of your Internal Assessment project.
The research methods in A2.1 are not limited to design. You will meet them again in other DP classes and at university. Some should feel familiar straight away, because you have already taken part in other people's research. Surveys written by students are usually built on Likert scales, and you have probably interviewed someone, or been interviewed yourself. (Asking for feedback on a project for MYP criterion D usually involves interviews.) Task analysis and focus groups may be new, but their names describe what they are, so they should not be hard to remember for Paper 1 and Paper 2.
The user persona is directly linked to a task in the IA project, and I highly recommend "reverse-engineering" some personas for a range of products and services as an exercise when learning about them.
Students must be able toExplain how developing empathy with users through an understanding of their needs and carrying out tasks in a specified environment leads to better design.
User-Centred Design (UCD) is an approach that places the needs, wants and limitations of end-users at the centre of the design process from start to finish. Rather than developing a product in isolation and then hoping users will adapt to it, UCD asks designers to stay in contact with real users. That contact happens before a concept exists, during development, and again after launch.
The term comes from the American cognitive scientist Donald Norman, who developed it in the 1980s. It became widely known through two of his books: User-Centered System Design (1986) and The Psychology of Everyday Things (1988), later renamed The Design of Everyday Things. Norman's complaint was straightforward. Too many products were difficult to use, and too many design changes were made for the sake of style rather than for the person holding the object.
The foundation of UCD is empathy, which means understanding a user's experience as if you were that user. Empathy is not guesswork. You build it through direct contact: watching people work, listening to them describe what frustrates them, and spending time in their environment. A designer who has spent an afternoon watching patients in a hospital waiting room understands that space in a way no second-hand description can match.
Three types of understanding drive UCD:
When designers understand all three, they avoid two costly mistakes. The first is a product with too few features, which fails to meet real needs. The second is a product with too many, which adds cost and complexity without meeting any need at all. Extra functions are often cheap to add, so the temptation is real, but the cost appears later as confusion.
Electronic interfaces show this pattern clearly. Microwave ovens, television remotes and smartphones frequently carry far more functions than most owners will ever use. The extra functions crowd out the two or three that people actually need. In a microwave, that confusion is merely annoying. In medical or industrial equipment, the same confusion becomes dangerous.
Products built for the general public are designed the other way around. An ATM has a standardised layout, a large display and a deliberately small set of functions, because its users cannot be trained beforehand and usually have nobody to ask for help.
The environment matters too. Most electronic products state a temperature range they can safely operate in, and many need shielding from strong magnetic fields. A greater risk comes from users applying a normal function in an abnormal situation. Texting while walking is the everyday example. More than a third of young people report having had an accident while doing it.
Research by Jacob Schmookler (1962) found that user need, not technological opportunity, is the most powerful driver of successful innovation.
A supermarket cart redesign that demonstrates UCD throughout
Read spotlight →Students must be able toExplain the five stages of UCD and the advantages and disadvantages of UCD when designing products that meet the requirements of a diverse range of user needs and capabilities.
The UCD process is usually structured around five stages. In each one, users are involved directly rather than being treated as passive recipients at the end. Notice that different specialists lead different stages.
Henry Petroski's book Invention by Design gives a good example of how careful companies are at the launch stage. When the easy-opening stay-on-tab can top appeared in the 1970s, it replaced a tab that shoppers pulled off and threw away. Because this was a genuine change in behaviour, beverage companies ran consumer studies first to check that people would accept it. Early cans were even printed with instructions explaining how to open the top.
Advantages of UCD:
Disadvantages of UCD:
Students must be able toExplain how different disciplines contribute to a better understanding of target user, task and environment when designing to meet the needs of specific target users.
No single discipline can meet all the needs of a diverse user population. A psychologist understands how people perceive and decide. An engineer understands what is structurally possible. A sociologist understands how culture shapes behaviour. An anthropologist understands how different communities live and work. A UCD team brings these disciplines together so that design decisions are informed by the full complexity of human experience.
Don Norman argues that good design only emerges when the product development process includes the concerns and the expertise of the target user and of the teams who manufacture, distribute, maintain and market the product. This is a real break from traditional practice, where designs were developed largely in isolation. Adriana Chammas, Manuela Quaresma and Claudia Mont'Alvão make the same point in A Closer Look at the User Centred Design (2015), writing that UCD "encourages the use of multidisciplinary expertise in order to provide creative and collaborative ideas between team members, benefiting the project with different perspectives and skills".
Five benefits of a multidisciplinary team:
These benefits come at a price. Several perspectives and several data sources are harder to manage, and they usually produce more design iterations before the team agrees.
Typical contributors to a UCD team include:
Case study: Mercury spacesuit. When NASA developed one of the earliest spacesuits in the late 1950s, the engineering team was joined by experts from biology, medicine, design and materials science, and everyone was asked to propose ideas freely. The most effective concept came from a biologist rather than an engineer.
Their collaboration produced solutions a single-discipline team would probably have missed:
Students must be able toExplain how user-centred research methods (field research, task analysis, user observation, interviews, surveys and focus groups) can be used to discover the true nature of a user population.
Each research method collects a different kind of information. Choose a method for what you need to know, not for how easy it is to run. All six generate one of two broad categories of data:
Field research. Observing users in their real environment, such as a kitchen, a factory or a school. It uncovers behaviour shaped by cultural norms, physical habits and surroundings, none of which users would think to mention in an interview. The risk is that observers may change the behaviour they came to watch.
In practice: supermarkets run field research across several stores at once. They track how customers move through the aisles, how they handle products, and how long they spend in front of a shelf. The results guide product placement and store layout.
Task analysis. Breaking a complex task into a hierarchy of smaller steps to find where errors, delays or frustration occur. It shows which sub-task causes the most friction, and it also exposes how much a user has to hold in mind at each stage. Findings feed straight into redesign decisions.
User observation. Watching users perform a specific task, either in the field or in a controlled setting. It captures hesitation, workarounds and errors that users would never report themselves. Unlike field research, observation is usually structured around one defined task.
In practice: gaming companies watch players to see where a game becomes confusing or frustrating, and which features get used most. The findings are used to adjust difficulty and rework gameplay mechanics.
Interviews. A direct conversation with a user, generating mostly qualitative data. Structured interviews use identical questions for every participant, so answers can be compared. Unstructured interviews follow the conversation and uncover the unexpected. Most real research sits in between, using a semi-structured format: a fixed set of questions with room to follow up.
In practice: telehealth is a young service, so researchers interview patients to understand why some are reluctant to use it. Only a conversation can get at the reasons behind that hesitancy.
Surveys and questionnaires. Distributed to large groups, and efficient for collecting quantitative data quickly. A Likert scale (1 = Strongly Disagree to 5 = Strongly Agree) turns attitudes into numbers that can be averaged and compared. The limitation is that a survey cannot ask a follow-up question, so it never explains why an answer was given.
In practice: a kitchen appliance manufacturer surveys owners on functionality, ease of use, satisfaction and whether they would recommend the product. The numbers show which features to add and which areas are causing dissatisfaction.
Focus groups. A structured, moderated discussion with a carefully selected part of the target audience, typically 6 to 10 people. It generates detailed qualitative data and shows how opinions shift as participants respond to each other. The risks are that one dominant participant can skew the discussion, and that a small group may not represent the wider population.
In practice: a coffee machine manufacturer convenes a focus group of potential buyers to discuss an unreleased model. The discussion surfaces both shared expectations and unusual individual concerns before the design is finalised.
| Method | Data type | Best suited when… | Key limitation |
|---|---|---|---|
| Field research | Qualitative | Behaviour is shaped by environment, culture or habits users cannot articulate | Observer presence may alter the behaviour being studied |
| Task analysis | Qualitative | A complex multi-step task needs mapping to find where friction occurs | Captures task structure only, not attitudes or motivations |
| User observation | Qualitative | Testing a specific interface or interaction for usability problems | Controlled settings do not always reflect real-world use |
| Interviews | Qualitative | Understanding motivations, opinions or experiences in depth | Small samples may not represent the wider population |
| Surveys / Likert | Quantitative | Measuring attitudes or frequencies across a large user group quickly | Cannot follow up to ask why a user gave a particular response |
| Focus groups | Qualitative | Exploring how perspectives develop through group discussion | Dominant participants can skew results; not representative at scale |
Select a research question below, then select the method that would actually answer it.
Students must be able toDiscuss how a primary persona, scenarios, population stereotypes and demographics can be used to guide design development, and discuss the advantages and disadvantages of using them when engaging with UCD.
After research data is collected, designers use a small set of tools to turn raw findings into a shared language that guides the whole team.
Personas: Fictional but research-based user profiles that represent a target group. A persona is not a real individual. It is a composite, drawn from patterns that appeared across many users. A well-constructed persona includes a name, age, occupation, goals, frustrations and relevant habits. Personas give every member of a multidisciplinary team a specific human being to design for, which makes abstract or self-referential decisions much harder to justify.
A fuller persona profile often records age, health, gender, interests, activities, life goals, education, motivation, employment, expectations, marital status and any organisations the person belongs to. You will not need every field for every project, but the more concrete the profile, the more decisions it can settle.
Advantages: they build empathy, they keep the team focused on specific user needs, and they make design reviews concrete ("would Maya be able to do this?"). Disadvantages: they date quickly as trends and technologies shift, they can reinforce stereotypes if the underlying research was not rigorous, and they can flatten a diverse population into a single profile.
Personas are widely used, but they are not above criticism. Researchers have pointed out that:
Scenarios: Short stories describing how a persona uses a product to reach a goal in a specific situation. A scenario anchors decisions in real use: "Maya is running late and tries to complete the checkout on her phone while standing in a queue." Scenarios expose unusual cases and conflicting priorities that a written specification hides. Building detailed scenarios does take time, and any wrong assumption about the user gets carried along with them.
Use cases: A use case is a written description of how a user will interact with a product, told from the user's point of view. Where a scenario sets the scene, a use case walks through the interaction step by step, which is what makes it useful for judging usability as the user actually experiences it.
Population stereotypes: Culturally shared assumptions about how a product should behave, built up through repeated exposure over many years. These are not personality stereotypes. They are learned expectations about controls, symbols and conventions, and they are a product of standardisation within a society rather than anything intrinsic to the machine. Examples:
Driving side is the largest example of all. Over 60% of the world drives on the right, and the reason for the split is still not settled. Explanations reach back to Roman chariots, medieval knights, Napoleonic conquest and simple courtesy to passengers. Some countries have switched sides outright: Canada in the 1920s, Sweden in 1967, Burma in 1970 and Samoa in 2009.
Population stereotypes make a product feel intuitive immediately, because it matches expectations built over a lifetime. Break one, even accidentally, and you get confusion and error instead. A user can learn an alternative arrangement with a little effort, but under stress people fall back on the older, deeper habit. That matters most in safety-critical design, such as medical devices and emergency equipment.
Demographics are the statistical characteristics used to describe a population: age, gender, income level, education, geographic location, occupation, household size and ethnicity. In UCD, demographic data forms the first layer of understanding before detailed research begins. Knowing that a product targets retired adults in rural areas immediately shapes decisions about interface complexity, physical accessibility and distribution channel.
Demographic data comes from census records, market research reports and screening questionnaires given to potential research participants before they are recruited. It connects directly to anthropometric data (see A1.1 Ergonomics): body dimensions, grip strength and visual acuity vary predictably across age, gender and population group.
Demographics also anchor personas. A well-constructed persona specifies demographic details precisely enough that two designers reading it would picture the same person. Without demographic grounding, personas risk being vague composites that do not represent any real user group.
Ten questions covering all five learning objectives. Select one answer per question, then click "Check all answers" to see your score and the explanations.
Matatus are privately owned minibuses that carry most commuters in Nairobi. Fares are paid in cash to a conductor who moves through a crowded vehicle, and the fare for the same route changes through the day with demand.
A payments company proposed replacing cash with a contactless card, tapped on a reader by the door. An earlier attempt by a different company had been withdrawn within a year.
Before designing the card and reader, the team spent six weeks on research.
Table 1: Research activities completed before the design brief was written
| Activity | Participants | Output |
|---|---|---|
| Riding 40 routes at different times, recording what happened at each boarding | — | Field notes, 212 boardings |
| Interviews with conductors and owners | 18 | Transcripts |
| Roadside survey of commuters | 604 | Response counts |
| Interviews with commuters who had abandoned the earlier card | 22 | Transcripts |
(a) State the user-centred research method used to produce the field notes in Table 1. [1]
(b) Outline why the team interviewed conductors and owners as well as commuters, see Table 1. [2]
(c) Explain why the roadside survey alone would not have told the team why the earlier card was abandoned, see Table 1. [3]
(a) User observation, carried out as field research.
(b) Conductors and owners are stakeholders whose behaviour decides whether the card is ever offered to a passenger, because the conductor collects the fare and the owner buys the equipment. A card that removes the conductor's control over cash threatens their income, so their objections would have sunk the product however well it suited commuters.
(c) A survey returns quantitative data, so it can establish how many people stopped using the earlier card but not what went through their minds when they did. The question set is fixed in advance, which means it can only test reasons the team has already thought of, and the reason a product fails is usually one nobody anticipated. Abandonment is also a sequence of events rather than a single opinion, and a respondent ticking a box cannot describe the moment the reader failed, what they did next, or how the conductor reacted. Interviews were needed because they let a respondent give an unanticipated answer and be asked why.
(a) • User observation ✓
• Field research ✓
Award [1] for the correct user-centred research method up to [1 max]. Accept either term.
(b) UCD teams develop a deep understanding of the user, the task and the environment.
• The conductor collects the fare, so the conductor operates the product, not only the commuter ✓
• The owner buys and maintains the reader, so the owner is the purchasing decision-maker ✓
• A card that removes cash handling threatens the conductor's income, which is a barrier no commuter research would reveal ✓
• Conductors know the informal fare rules that vary through the day and are not written down anywhere ✓
• The earlier product's withdrawal may have been driven by operator refusal rather than commuter rejection ✓
• Designing for one stakeholder group produces a solution the others will not adopt ✓
Award [1] for each relevant brief point explaining why conductors and owners were included in the research up to [2 max].
(c) User-centred research methods gather qualitative and quantitative data, and each answers a different kind of question.
• A survey produces quantitative data, which measures how many but not why ✓
• The question set is fixed before the survey runs, so it can only test reasons already anticipated by the team ✓
• The reason a product fails is often one the design team did not think of, and a closed question cannot surface it ✓
• A respondent cannot be asked a follow-up question, so an unexpected answer cannot be pursued ✓
• Abandonment is a sequence of events, and a tick box cannot capture what happened in order ✓
• Interviews produce qualitative data, giving depth and the user's own account in their own words ✓
• The 22 interviews target the specific population who abandoned the card, which the roadside survey of 604 commuters does not isolate ✓
• The two methods are complementary: the survey establishes scale, the interviews establish cause ✓
Award [1] for each relevant reason / cause explaining why the roadside survey alone would not establish why the earlier card was abandoned up to [3 max]. Award a maximum of [2] where the response does not distinguish quantitative from qualitative data.
A city council introduced a 7 litre kitchen caddy for food waste, emptied by residents into a larger kerbside bin. Take-up in the trial district was poor. The council commissioned research before redesigning the caddy.
Researchers visited 60 households, asked to see where the caddy was kept, and photographed it in place. They also weighed the contents of the kerbside bins on collection day.
Table 2: Findings from the 60 household visits
| Finding | Households |
|---|---|
| Caddy stored under the sink, out of sight | 41 |
| Caddy still in its delivery wrapping | 17 |
| Caddy used for something other than food waste | 9 |
| Reported the lid was hard to open with one hand | 34 |
| Reported smell as the main objection | 38 |
(a) State whether the bin weights collected on collection day are qualitative or quantitative data. [1]
(b) Identify two limitations of relying on what residents reported, rather than on what the researchers observed, see Table 2. [2]
(c) Justify the decision to visit households in person rather than post a questionnaire, see Table 2. [3]
(a) Quantitative.
(b) Residents answer in the way they think reflects well on them, so the 38 who named smell may be offering an acceptable reason for not using a caddy they never unwrapped. Residents also cannot report what they have not noticed: 41 stored the caddy out of sight, and being out of sight is a stronger predictor of non-use than anything a resident would think to mention.
(c) The most useful findings in Table 2 are physical facts about where the caddy sits, and only a visit produces them. Seventeen caddies were still wrapped, which is direct evidence of non-adoption that no resident would volunteer on a form. Visiting also let researchers photograph the caddy in its real setting, so the design team could see the actual under-sink space the product has to compete for rather than work from a description. A posted questionnaire would have returned answers only from the residents already engaged enough to reply, which biases the sample towards users and away from the non-users the council needed to understand.
(a) • Quantitative ✓
Award [1] for the correct classification up to [1 max].
(b) • Residents give socially acceptable answers rather than accurate ones ✓
• Reported smell may be a justification offered after the fact by residents who never used the caddy ✓
• Residents cannot report behaviour they are not aware of, such as storing the caddy out of sight ✓
• Recall of routine behaviour is unreliable ✓
• Self-report cannot be checked, whereas 17 wrapped caddies is a verifiable fact ✓
• Residents report what they think the council wants to hear about a council scheme ✓
Award [1] for each relevant limitation identified up to [2 max]. Do not credit two statements of the same limitation.
(c) UCD teams develop a deep understanding of the user, the task and the environment.
• The decisive findings are physical facts about the product in place, which only a visit produces ✓
• Seventeen caddies still wrapped is direct evidence of non-adoption that no resident would volunteer ✓
• Photographing the caddy in situ shows the design team the real under-sink space it competes for ✓
• A visit lets the researcher ask a follow-up question about something they can see ✓
• A postal questionnaire returns replies only from engaged residents, biasing the sample towards users ✓
• The non-users are the population the council most needed to reach, and they are the least likely to reply ✓
• Observation captures the environment, which is one of the three things a UCD team must understand ✓
• The one-handed lid problem is easier to demonstrate than to describe ✓
Award [1] for each valid reason / piece of evidence supporting the decision to visit households in person up to [3 max]. Credit responses that reason from the data in Table 2.
A national health service runs an online symptom checker. A member of the public answers a sequence of questions about their symptoms and is directed to self-care, a pharmacy, a routine appointment, an urgent appointment or an ambulance.
The service is used by the whole adult population. A redesign team was assembled to rebuild it.
(a) List two disciplines, other than interaction design, that should be represented on the team designing the symptom checker. [2]
The team wrote three personas from its research.
Table 3: Extract from the persona set
| Persona | Profile | Need |
|---|---|---|
| Ade, 34 | Night-shift warehouse worker, uses a phone only, no home broadband | Wants to know whether a symptom can wait until the shift ends |
| Margaret, 78 | Lives alone, tablet computer, hearing loss, tends to understate symptoms | Wants reassurance without being told to call an ambulance |
| Priya, 29 | Parent of a 2-year-old, uses the service on behalf of the child | Wants a fast answer while holding a distressed child |
(b) Outline why Priya's entry in Table 3 changes a design assumption built into the original service. [2]
The team also wrote a scenario for each persona, describing a single use of the service from beginning to end. Margaret's scenario ends with her closing the browser after being asked to rate her pain from one to ten.
(c) Describe what the scenario adds that the persona in Table 3 does not. [2]
A team member proposed adding a fourth persona described as "a typical elderly user, not confident with technology, needs large text".
(d) Explain the risks of building the symptom checker around the proposed fourth persona. [4]
(a) Clinical medicine, and accessibility or inclusive design.
(b) The original service assumes the person answering the questions is the person with the symptoms, so it asks "where does it hurt?" and expects a first-hand answer. Priya is reporting on behalf of a two-year-old who cannot describe a symptom, so every question has to be answerable by an observer describing someone else.
(c) The persona describes who Margaret is; the scenario describes what happens when she uses the service, in sequence and over time. That turns a static profile into a testable account with a failure point in it, because the scenario identifies the exact question that made her abandon the service. A persona cannot contain a moment of failure, only a set of attributes.
(d) The proposed persona is a population stereotype rather than a persona. It is assembled from an assumption about a demographic group instead of from research data, so nothing in it can be traced back to an observed user, and there is no way to test whether it is true.
Because it is built on age alone, it treats a group spanning thirty years and every level of technical confidence as one person. Margaret is 78 and uses a tablet; the stereotype would have predicted she does not. Designing to the stereotype rather than to Margaret produces a service pitched at a user who does not exist.
It also imports assumptions that direct the design at the wrong problem. "Needs large text" is a solution smuggled in as a need, and it puts effort into type size when Margaret's scenario shows the service lost her at a pain-rating question. Her real difficulties, hearing loss and a tendency to understate symptoms, are clinically the most dangerous thing in Table 3 and the stereotype does not mention them.
Finally, a stereotype invites the team to design for a group it has decided is deficient, which produces a separate simplified version rather than one service that works for everyone.
(a) UCD teams are multidisciplinary and develop a deep understanding of the user, the task and the environment.
• Clinical medicine / nursing ✓
• Accessibility or inclusive design ✓
• Content design or plain-language writing ✓
• Software engineering ✓
• Data science / triage algorithm specialist ✓
• Psychology or behavioural science ✓
• Public health ✓
• Legal or clinical governance ✓
Award [1] for each relevant discipline up to [2 max]. Do not credit interaction design.
(b) Personas represent attributes of user populations and are used to guide design development.
• The service assumes the user and the patient are the same person ✓
• Priya reports on behalf of a child, so the user is a proxy ✓
• A two-year-old cannot describe a symptom, so questions must be answerable by observation ✓
• Question wording addressed to "you" becomes ambiguous when a proxy answers ✓
• Age-dependent clinical thresholds mean the service must establish whose symptoms these are before it asks anything ✓
• The proxy is also under stress and holding the child, so the interaction must tolerate interruption ✓
Award [1] for each relevant brief point explaining how Priya's entry changes a design assumption up to [2 max]. The response must identify the proxy relationship for full marks.
(c) Design development uses personas, scenarios and population stereotypes early in the design process.
• A scenario describes a specific use of the product from beginning to end, in sequence ✓
• The persona is static and describes attributes; the scenario adds time and events ✓
• The scenario places the persona in a context and a task, which the profile alone does not ✓
• It identifies the exact point at which the service failed, the pain-rating question ✓
• A failure point is testable against the real product, so the scenario can be used as a test script ✓
• It shows what the user does next, in Margaret's case abandoning the service rather than calling for help ✓
Award [1] for each detail, leading to an account of what the scenario adds beyond the persona, up to [2 max]. Award a maximum of [1] where the response describes a scenario without contrasting it with the persona.
(d) A persona is a generalized profile of users who are experiencing a challenge in a process that presents a design opportunity [definition]. A population stereotype is an assumption about how a group behaves and is not a substitute for research data.
It is a stereotype, not a persona:
• It is built from an assumption about a demographic rather than from collected research data ✓
• Nothing in it traces back to an observed user, so it cannot be checked or falsified ✓
• The other three personas carry specific evidenced detail; this one carries none ✓
It collapses a diverse population:
• "Elderly" spans thirty years and every level of technical confidence ✓
• Margaret is 78 and uses a tablet, which the stereotype predicts she would not ✓
• Designing to an average of a group produces a user who does not exist ✓
It misdirects the design:
• "Needs large text" states a solution rather than a need, closing off the design before it starts ✓
• Effort goes into type size while Margaret's actual failure was a pain-rating question ✓
• Her hearing loss and tendency to understate symptoms are the clinically dangerous attributes and are absent from the stereotype ✓
• Understated symptoms in a triage service risk an under-urgent recommendation, which is a safety issue ✓
Consequences:
• It encourages a separate simplified version rather than one service that works for everyone ✓
• It embeds an assumption of deficiency, which is a form of designer bias ✓
• Decisions justified by the stereotype cannot be defended to a client or a regulator because there is no evidence behind them ✓
Award [1] for each relevant detail / reason / cause relating to the risks of building the service around the proposed fourth persona up to [4 max]. Award a maximum of [2] where the response does not identify the proposal as a population stereotype. Credit responses that use Table 3 as evidence.
Linking Questions
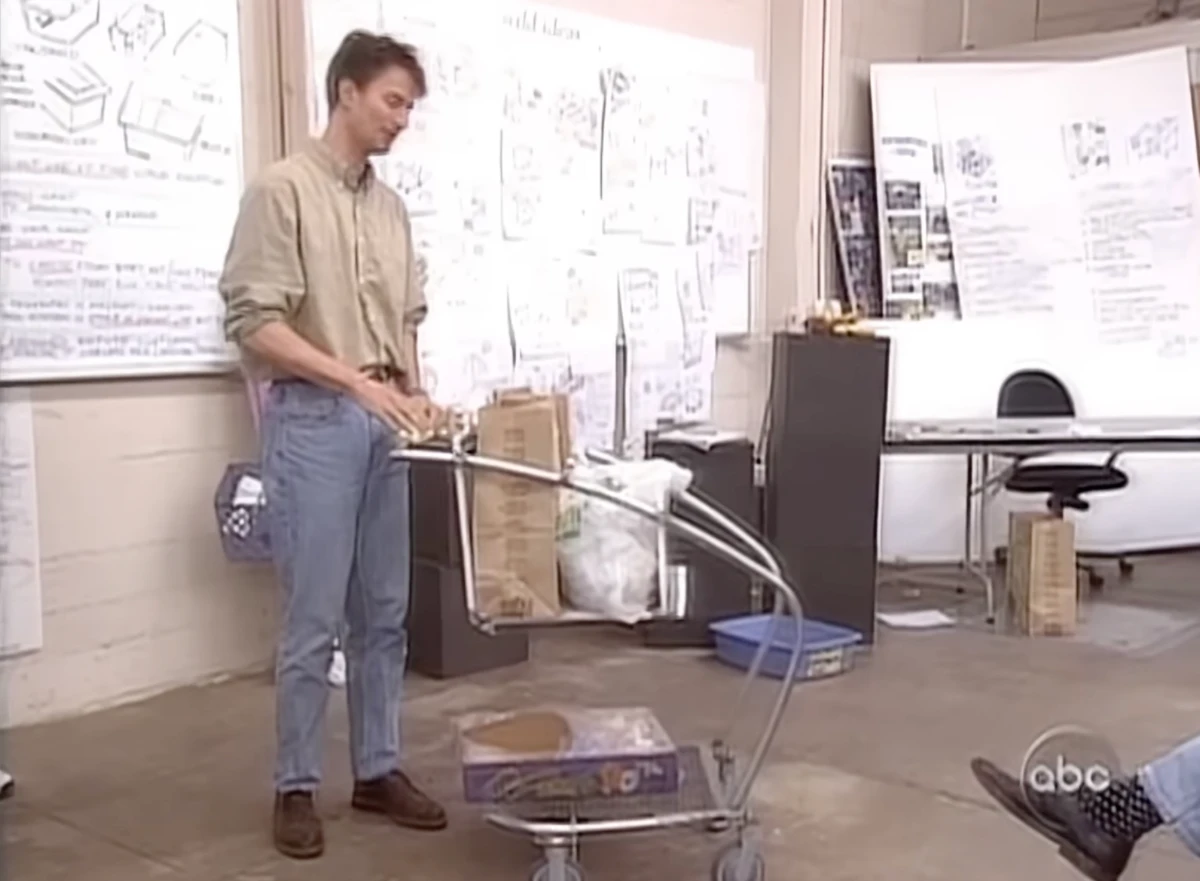
In 1999, the US news programme Nightline gave the design firm IDEO five days to redesign the ordinary supermarket shopping cart. They filmed the whole process for a segment called "The Deep Dive." The team didn't just start by sketching carts or building prototypes. Rather, they went to supermarkets and watched how people actually used them. (User observation!). Among other observations they noted that people really don't like to let go of the cart when shopping. They also read the safety record, which showed more than 20,000 cart-related injuries reported in the US each year from tipping and jammed wheels. A safety expert and a childproofing consultant sat in on the research too.
Design director Tom Kelley's team then ran a single afternoon of brainstorming under strict "defer judgment, go for quantity" rules, producing around 200 concepts on a whiteboard before anyone built anything. Four ideas survived into the prototype. Baskets can be placed on rails, and later lift off the frame, allowing for easier access and allowing customers to choose how much storage they need. A sweeping tube system replaced the boxy cage. Swivelling wheels allow sideways movement in tight aisles. The child seat was redesigned entirely to improve safety and usability. Whether or not the cart itself ever reached shelves, the documentary became one of the most widely taught examples of what a compressed, research-first design process looks like in practice.