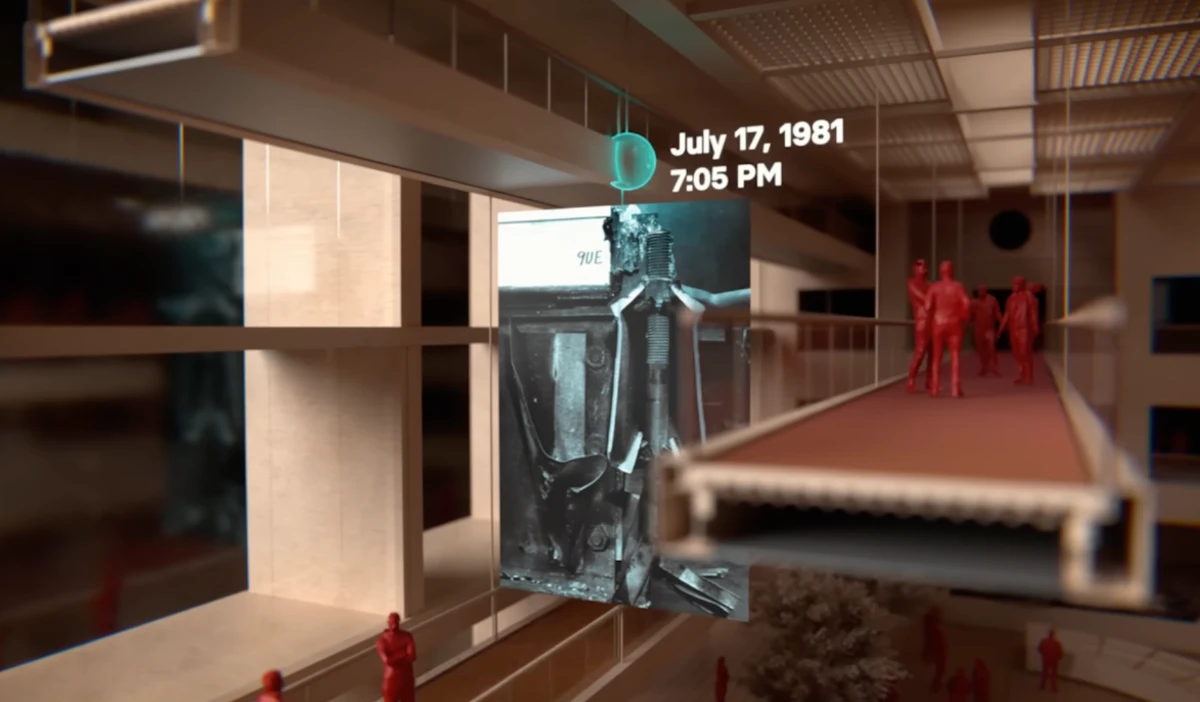
The Hyatt Regency Walkway Collapse
The deadliest structural failure in US history.
Read case study →Guiding questionHow can structural systems be incorporated into product design?
This is where structures get numbers attached, and numbers are what make a structural claim checkable. Saying a beam is strong enough is an opinion. Saying it carries 4 kN with a safety factor of 3 is a promise somebody can hold you to, and engineering runs on promises of that kind.
Expect calculation, and expect to practise it rather than read about it. Stress, strain, Young's Modulus and safety factors are not conceptually difficult, but they punish carelessness with units and rearrangement, and Paper 2 gives no credit for having understood an idea whose arithmetic collapsed. The failure case studies deserve your attention too. Structural failures are unusually well documented, because when a bridge falls down somebody writes a very thorough report explaining why, and reading those reports is the fastest way to learn what an inadequate safety factor actually costs.
Students must be able toAnalyse and model the forces acting on and within the structure of existing products and be able to suggest how existing structures can be strengthened.
A structure is any system of interconnected parts designed to support loads and resist forces without unacceptable deformation or failure. Structures appear in every product: a chair's legs, a mobile phone's chassis, a bicycle frame, a bridge deck, and a skyscraper's core are all structures serving the same fundamental purpose.
Five types of stress act on structures:
Load types:
Designers analyse structures by identifying all load types, determining how they combine in the worst-case scenario, and ensuring every structural member can carry its share of those combined loads with an adequate safety margin.
Students must be able toCalculate Young's Modulus using the formula E = σ / ε, and interpret stress-strain graphs identifying Young's Modulus, yield strength, ultimate strength and fracture.
Stress (σ) is the internal force per unit cross-sectional area that a material develops in response to an applied load:
σ = F / A [Pa or MPa; note: 1 N/mm² = 1 MPa]
Where F = applied force (N) and A = cross-sectional area (m² for Pa; mm² for MPa). Use mm² consistently to work in MPa directly.
Strain (ε) is the fractional change in length caused by that stress:
ε = ΔL / L₀ [dimensionless: no units]
Where ΔL = change in length and L₀ = original length (use consistent units: both mm, or both m).
Young's Modulus (E), or stiffness, is the ratio of stress to strain in the elastic (linear) region of the stress-strain graph:
E = σ / ε [GPa or MPa]
E is the slope of the straight-line portion of the stress-strain curve. A steeper slope = stiffer material. Steel: E ≈ 200 GPa. Aluminium: E ≈ 70 GPa. Rubber: E ≈ 0.01–0.1 GPa.
Reading the stress-strain graph (key points):
Effect of temperature: For plain carbon steels, Young's Modulus decreases as temperature increases. At elevated temperatures, steel softens and its stiffness falls: a critical consideration for fire-resistant structural design and high-temperature industrial equipment.
Worked example (calculating Young's Modulus):
A steel test piece, original length 50 mm and cross-sectional area 20 mm², is pulled with a force of 80 kN. It stretches 0.1 mm. Find E.
σ = F / A = 80,000 N / 20 mm² = 4,000 MPa
ε = ΔL / L₀ = 0.1 mm / 50 mm = 0.002
E = σ / ε = 4,000 MPa / 0.002 = 2,000,000 MPa = 200 GPa ✓ (consistent with steel)
Students must be able toIdentify why a structure has failed, including interpreting data from finite element analysis (FEA).
Structural failure occurs when stress in any part of a structure exceeds the material's capacity to resist it. Failure modes fall into four main categories:
Case study (Quebec Bridge collapse, 1907):
During construction of what was to be the world's longest cantilever bridge (548 m main span), the south anchor arm collapsed, killing 75 of the 86 workers on site. The primary cause was the underestimation of the structure's own weight: the calculated weight was 30,857 tonnes but the actual weight was later found to be 36,408 tonnes. This led to compressive stresses in the lower chord members that exceeded the material's buckling resistance. Signs of buckling had been observed and reported for nearly a month before the collapse, but work continued. The bridge collapsed two hours after buckling was formally reported to the chief engineer.
Engineering lessons: Accurate weight calculations are non-negotiable. Warning signs of buckling must be acted on immediately. Clear lines of responsibility and authority to halt construction are essential. The disaster directly led to the reform of Canadian professional engineering standards.
Case study (Tacoma Narrows Bridge collapse, 1940):
The Tacoma Narrows Bridge was revolutionary in its slenderness: a depth-to-span ratio of 1:350 (compared to the typical 1:84 of contemporary suspension bridges) and a width-to-span ratio of 1:72, the narrowest of any comparable bridge. Its shallow plate girder sides acted as a solid wall to wind, rather than allowing air to pass through as an open truss would. During construction, the bridge already oscillated vertically in wind, earning the nickname "Galloping Gertie." Four months after opening, a 67 km/h gale induced a coupled bending-torsion oscillation (aeroelastic flutter): the roadway twisted at increasing amplitude until the deck tore apart.
Engineering lessons: Wind is not just a static pressure load; it can induce dynamic resonance. Torsional stiffness and aerodynamic stability are as important as vertical strength. Wind tunnel testing of scale bridge models became mandatory following this failure. Modern long-span bridges use open truss girders, aerodynamic deck profiles, and tuned mass dampers to prevent flutter.
Case study (Genoa Morandi Bridge collapse, 2018):
A 210 m section of the cable-stayed Morandi Bridge collapsed, killing 43 people. The failure was caused by decades of corrosion to steel cables inside the bridge's distinctive reinforced concrete pylons, combined with deterioration of the prestressed concrete. The original design embedded the stay cables inside concrete shrouds, a design that prevented inspection or replacement of the steel. Corrosion progressed invisibly until the cable system no longer had sufficient capacity to carry the bridge's dead load.
Engineering lessons: Safety factors degrade over time as materials corrode and fatigue. Infrastructure must be designed for inspectability and maintainability: hidden structural elements are a design failure, not just an operational problem. The replacement bridge (Genoa San Giorgio, 2020), designed by Renzo Piano, incorporates continuously operating monitoring robots that inspect every structural element for corrosion and cracking.
Finite Element Analysis (FEA):
FEA is a computational method that divides a complex structure into thousands of tiny elements (triangles or tetrahedra in 2D/3D). The software applies loads and constraints, then calculates stress, strain, and displacement at each element. The results are displayed as colour maps (stress contour plots): regions in red/orange indicate the highest stress, green and blue indicate lower stress. Designers use FEA to:
Interpreting FEA output: a region shown in red that coincides with a geometric feature (hole, fillet, notch) is a stress concentration: the designer should increase the radius of the fillet, add a gusset plate, or choose a stronger material for that region. A large region of uniform low stress (blue) indicates over-engineered material that could be removed to reduce weight.
Buckling does not happen because a member runs out of compressive strength; it happens because a slender member finds a cheaper way to fail first. Leonhard Euler showed that the load at which a slender column suddenly bows sideways, the critical buckling load, depends on the member's stiffness and geometry rather than its material strength alone: P_cr = π²EI / L_e², where E is Young's Modulus, I is the second moment of area of the cross-section, and L_e is the effective length (which depends on how the ends are restrained).
This explains several design choices already seen in this topic: a hollow tube or I-section resists buckling better than a solid rod of the same cross-sectional area because it has a larger second moment of area (I) for the same amount of material. It also explains why the Quebec Bridge's lower chord members buckled at a load below their material's compressive strength: the members were slender enough that geometry, not material strength, set the failure point.
The deadliest structural failure in US history.
Read case study →None of the four failure categories above quite describe the Hyatt Regency collapse: the walkways weren't overloaded beyond their intended design capacity, the steel wasn't the wrong material, and nothing buckled from slenderness. A connection detail was changed during construction in a way that looked equivalent on the drawing but roughly doubled the load on a single set of box-beam welds, cutting their safety factor to barely above 1.
Read the case study, then discuss: at what point in a project should a "simple" fabrication change to a structural connection require the same level of recalculation as a change to the main structure itself? Whose job should it be to catch that kind of change: the structural engineer, the fabricator, a third-party checker, or all three?
Students must be able toInterpret simple force diagrams for a given structure.
Engineers represent forces and their effects using standardised diagrams. Three types are essential for structural analysis:
1. Free Body Diagrams (FBDs)
A free body diagram isolates a single object (or a section of a structure) and shows all external forces acting on it as vectors: arrows indicating direction and magnitude. FBDs are the starting point for every structural calculation.
Rules for drawing FBDs:
2. Force polygons (tip-to-tail vector addition)
When multiple forces act on a point, their resultant (combined effect) can be found graphically. Draw each force vector to scale, placing the tail of each arrow at the tip of the previous one. The resultant is the vector from the starting point to the final tip. If the forces are in equilibrium, the polygon closes (the last tip meets the first tail): this is the graphical equivalent of ΣF = 0.
3. Support reactions
Before drawing shear force and bending moment diagrams, the reactions at all supports must be found using the two equilibrium equations:
ΣF = 0 (sum of all vertical forces = 0)
ΣM = 0 (sum of moments about any point = 0)
Two support types:
Worked example (finding support reactions): A 6 m simply-supported beam carries a 10 kN point load at 2 m from the left (pinned) support A. Find reactions R_A and R_B (roller at B).
Take moments about A: ΣM_A = 0 → R_B × 6 = 10 × 2 → R_B = 20/6 = 3.33 kN
ΣF_vertical = 0 → R_A + R_B = 10 → R_A = 10 − 3.33 = 6.67 kN
4. Shear force diagrams (SFD)
A shear force diagram plots the internal shear force at every cross-section along the beam. Sign convention: shear that tends to cause clockwise rotation of the left segment is positive (+). The diagram is built by working from left to right, adding each load or reaction encountered. Point loads cause vertical jumps in the diagram; uniformly distributed loads (UDL) cause linear slopes.
5. Bending moment diagrams (BMD)
A bending moment diagram plots the internal bending moment at every cross-section. The critical rule: maximum bending moment occurs where shear force equals zero. The BMD is the area under the SFD. Point loads produce triangular shapes; UDLs produce parabolic curves. The BMD is essential for sizing the beam: the peak moment location is where the beam is most likely to fail in bending.
Uniformly distributed loads (UDL): Expressed in kN/m. A UDL of 5 kN/m over 4 m is equivalent to a point load of 20 kN at the midpoint of the span for the purpose of calculating support reactions. The total UDL force = w × L where w is load intensity (kN/m) and L is span length (m).
Cantilever beams: Fixed at one end, free at the other. The fixed support must resist both vertical force and bending moment. The maximum bending moment in a cantilever occurs at the fixed end, not in the middle. Examples: Stadium roof canopies, balconies, aircraft wings. A UDL on a cantilever of length L and intensity w gives: maximum bending moment M_max = w × L² / 2 at the fixed end.
Students must be able toCalculate SFs using the formula SF = Ultimate Load (Stress) / Allowable Load (Stress); calculate maximum intended loads for given structures; and design structures with an SF.
The safety factor (also called factor of safety, FOS) is the ratio of a structure's ultimate strength to the maximum stress it is designed to carry in service:
SF = Ultimate Load (or Stress) / Allowable Load (or Stress)
Rearranged to find allowable working stress:
σ_working = UTS / SF
And maximum working load:
F_working = σ_working × A = (UTS / SF) × A
Why use a safety factor? Real structures operate in conditions that are imperfect, unpredictable, and changing. The SF absorbs uncertainty across nine categories:
Typical safety factors by application (from A3.2):
| Application | Typical SF | Key reason |
|---|---|---|
| Bridges and buildings | 1.5–3 | Long design life; public safety; difficult inspection |
| Aircraft structures | 1.2–2 | Weight-critical; redundant systems; strict certification |
| Lifting equipment (cranes, hoists) | 4–6 | Dynamic shock loads; no redundancy; cable wear |
| Pressure vessels | 3.5–5 | Catastrophic explosive failure; corrosion from contents |
Worked example 1 (calculating SF):
A steel rod (diameter 12 mm) fails at a load of 90 kN. It is designed to carry a working load of 30 kN. What is the SF?
A = π × d² / 4 = π × 144 / 4 = 113.1 mm²
UTS = 90,000 / 113.1 = 795.8 MPa
σ_working = 30,000 / 113.1 = 265.3 MPa
SF = 795.8 / 265.3 = 3.0
Worked example 2 (calculating maximum working load, from the MD):
A 16 mm diameter steel rod has UTS = 590 MPa and SF = 4. Find the maximum working load.
A = π × 16² / 4 = 201.1 mm²
σ_working = 590 / 4 = 147.5 MPa
F_working = 147.5 × 201.1 = 29,662 N ≈ 29.7 kN
Safety factors degrade over time (the Genoa Morandi lesson):
The Morandi Bridge was designed with an adequate SF at opening in 1967. Over 50 years, corrosion of the embedded steel cables progressively reduced their cross-sectional area and tensile strength, effectively lowering the actual SF year by year. By 2018, the SF for the corroded cables had fallen below 1, and the bridge collapsed. The lesson: the SF at the time of construction is not the SF in service. Infrastructure monitoring, regular inspection, and maintenance are required to keep the actual SF above the design SF throughout the structure's intended life.
Ten questions covering the learning objectives for this topic. Select one answer per question, then click "Check all answers" to see your score and the explanations.
A climbing carabiner is an aluminium alloy link with a spring gate. It connects a climber's rope to an anchor. A falling climber can load it far beyond their body weight, because the rope arrests the fall over a short distance.
Every carabiner is marked with three rated strengths.
Table 1: Markings and dimensions of one carabiner
| Property | Value |
|---|---|
| Major axis, gate closed | 24 kN |
| Major axis, gate open | 8 kN |
| Minor axis | 7 kN |
| Cross-sectional area of the spine | 48 mm² |
| Alloy ultimate tensile strength | 500 MPa |
| Typical peak load in a lead fall | 6 kN |
(a) State the type of stress acting along the spine of the carabiner when it is loaded on the major axis. [1]
(b) Apply the definition of stress to describe why the spine does not fail at the rated 24 kN, see Table 1. [2]
(c) Explain why a carabiner loaded on its minor axis is dangerous, see Table 1. [3]
(a) Tensile stress.
(b) Stress is force divided by cross-sectional area. At the rated load of 24 kN across 48 mm² the spine carries 24 000 N ÷ 48 mm² = 500 N/mm², which is 500 MPa. That is exactly the alloy's ultimate tensile strength, so 24 kN is the load at which the spine reaches failure and the rating is set at the limit rather than above it.
(c) The minor axis rating is 7 kN against 24 kN on the major axis, so the carabiner is less than a third as strong across its width. The reason is that loading across the minor axis does not put the spine in pure tension; it bends the frame and applies force to the gate, which is a light spring-loaded component never intended to carry load. The danger comes from comparing 7 kN with the 6 kN peak load of a typical lead fall, which leaves a margin of only 1 kN, less than a safety factor of 1.2, and a harder fall exceeds it outright. What makes this a design problem rather than a user error is that the carabiner can rotate into that orientation on its own during a climb, so the load case that is nearly four times weaker can arise without the climber doing anything wrong or being able to see it happen.
(a) • Tensile stress ✓
Award [1] for the correct type of stress up to [1 max].
(b) Stress is force per unit cross-sectional area.
• Stress = force / area ✓
• 24 000 N ÷ 48 mm² = 500 N/mm² ✓
• 500 N/mm² = 500 MPa ✓
• This equals the alloy's ultimate tensile strength ✓
• 24 kN is therefore the load at which the spine reaches failure ✓
• The rating is set at the limit rather than above it ✓
Award [1] for the correct application of stress = force / area and [1] for relating the result to the ultimate tensile strength, up to [2 max]. Accept correct working in consistent units.
(c) Structures fail due to overloading, material choice, size and shape.
• The minor axis rating is 7 kN against 24 kN, less than a third the strength ✓
• Loading across the minor axis does not put the spine in pure tension ✓
• It bends the frame rather than stretching it ✓
• Load is applied to the gate, a light spring component never intended to carry it ✓
• 7 kN against a 6 kN typical peak fall load leaves a margin of only 1 kN ✓
• That is a safety factor below 1.2 ✓
• A harder than typical fall exceeds the rating outright ✓
• The carabiner can rotate into this orientation on its own during a climb ✓
• The weaker load case arises without user error and is not visible to the climber ✓
• The 8 kN gate-open figure shows the same effect, since an open gate removes the closed frame ✓
Award [1] for each relevant reason / cause explaining the danger of minor axis loading up to [3 max]. Credit responses that compare the rating with the fall load in Table 1.
A shelf bracket is an L-shaped steel pressing screwed to a wall. The horizontal arm carries the shelf; the vertical arm is fixed by two screws. A diagonal strut can be added between the two arms.
Loading the end of the shelf bends the horizontal arm and tries to pull the top screw out of the wall.
Table 2: Two bracket designs under a 400 N load at the end of a 300 mm arm
| Plain L bracket | With diagonal strut | |
|---|---|---|
| Bending moment at the corner | 120 N·m | 120 N·m |
| Bending in the horizontal arm | Along full 300 mm | Along 90 mm only |
| Force in the strut | — | Compression |
| Deflection at the shelf end | 11 mm | 1.5 mm |
| Steel used | 1.0 | 1.15 |
(a) State the type of force carried by the diagonal strut, see Table 2. [1]
(b) Apply the relationship between bending moment and distance to describe why the strut reduces deflection so sharply, see Table 2. [2]
(c) Analyse why the bending moment at the corner is unchanged by the strut, see Table 2. [3]
(a) Compression.
(b) Bending moment is force multiplied by distance from the support, and deflection of a cantilever grows with the cube of its unsupported length. The strut moves the effective support from the corner out to where it meets the arm, cutting the unsupported length from 300 mm to 90 mm. Because that is roughly a third of the length, deflection falls by roughly a factor of twenty-seven, which is why 11 mm becomes 1.5 mm for only 15 % more steel.
(c) The bending moment at the corner is set by the external load and its distance from the wall, and the strut changes neither. The shelf still carries 400 N at 300 mm, so the wall still has to resist 400 × 0.3 = 120 N·m regardless of what happens inside the bracket. This follows from equilibrium: the moment the wall applies must balance the moment the load applies, and adding a member between two points on the same bracket is an internal rearrangement that cannot alter the external balance. What the strut does change is how that moment is carried. Without it, the moment is resisted by bending along the whole arm; with it, most of the arm is in direct compression or tension along its length and only the outer 90 mm bends. So the strut redistributes the internal forces into more efficient paths without reducing what the fixing has to withstand, which is why the screws and the wall plug still have to be sized for the full 120 N·m.
(a) • Compression ✓
Award [1] for the correct force type up to [1 max].
(b) Forces acting on a structure or within a beam can be represented diagrammatically.
• Bending moment is force multiplied by distance from the support ✓
• Cantilever deflection grows with the cube of the unsupported length ✓
• The strut moves the effective support out to where it meets the arm ✓
• Unsupported length falls from 300 mm to 90 mm ✓
• That is roughly one third, so deflection falls by roughly a factor of 27 ✓
• 11 mm becomes 1.5 mm for 15 % more steel ✓
Award [1] for correctly applying the length relationship and [1] for relating it to the deflection values in Table 2, up to [2 max]. Accept an answer arguing from the reduced lever arm without the cube law, provided the reasoning is correct.
(c) When forces on a structure are in equilibrium, the structure is stable.
• The bending moment at the corner is set by the external load and its distance ✓
• The strut changes neither the load nor its distance ✓
• The shelf still carries 400 N at 300 mm, so the moment is 400 × 0.3 = 120 N·m ✓
• Equilibrium requires the wall's moment to balance the load's moment ✓
• A member added between two points on the same bracket is an internal rearrangement ✓
• Internal members cannot alter the external force balance ✓
• What changes is how the moment is carried, not its magnitude ✓
• Without the strut the moment is resisted by bending along the whole arm ✓
• With it, most of the arm carries direct compression or tension and only 90 mm bends ✓
• The screws and wall plug must still be sized for the full 120 N·m ✓
• A stiffer bracket is not a lower-loaded fixing, which is a common design error ✓
Award [1] for each distinct guiding element / structure identified in why the moment is unchanged up to [3 max]. Award a maximum of [2] where the response does not reason from equilibrium or from the external load.
A playground climbing frame is built from steel tube. Children hang from a horizontal bar 2.2 m above a rubber surface. The frame is specified to carry six children at once, and the bar is checked against a load of 6 × 800 N to allow for dynamic swinging.
(a) Identify two reasons the design load exceeds the combined weight of six children. [2]
Table 3: Two candidate tubes for the horizontal bar
| Tube A | Tube B | |
|---|---|---|
| Material | Mild steel | Aluminium alloy |
| Young's modulus | 210 GPa | 69 GPa |
| Yield strength | 250 MPa | 270 MPa |
| Outside diameter | 42 mm | 42 mm |
| Wall thickness | 3.0 mm | 3.0 mm |
| Mass per metre | 2.9 kg | 1.0 kg |
(b) Apply the meaning of Young's modulus to outline how the two tubes differ in service, see Table 3. [2]
Both tubes have the same geometry, so both have the same cross-sectional area of 367 mm². The bar is supported at both ends.
(c) Describe why the two tubes have nearly the same yield strength but very different stiffness, see Table 3. [2]
The designer must select a tube and a safety factor. Typical safety factors are 2 for static structures under known loads and 4 to 6 where loads are uncertain or failure endangers people.
(d) Explain how the designer should select the tube and the safety factor, see Table 3. [4]
(a) Children swing and drop onto the bar, so the dynamic load exceeds their static weight; and more than six children may use it, since nothing prevents it.
(b) Young's modulus is the ratio of stress to strain, so it measures how much a material stretches or bends for a given load. Steel at 210 GPa is about three times stiffer than aluminium at 69 GPa, so with identical geometry the aluminium bar deflects roughly three times as far under the same group of children.
(c) Yield strength and stiffness are independent properties describing different things: strength is the stress at which the material begins to deform permanently, while stiffness is how much it deforms elastically before that point. Yield strength depends on alloying and heat treatment, which can be varied widely, whereas Young's modulus is set by the bonding between atoms and barely changes with alloying, so an aluminium alloy can be made as strong as mild steel while remaining about a third as stiff.
(d) The two decisions are linked, because the tube choice determines which failure mode the safety factor has to guard against.
On strength the tubes are almost equivalent, with 270 MPa against 250 MPa on identical sections, so strength alone does not separate them. What separates them is stiffness, and stiffness is what a user experiences. A bar that visibly sags under six children feels unsafe whether or not it is safe, and the aluminium bar deflects roughly three times as far for the same load. Deflection also matters structurally here, because children swing on the bar rather than hanging still, and a springy bar stores and returns energy, which encourages more vigorous use and raises the dynamic load the designer was trying to allow for.
Steel is the correct selection. The aluminium tube's advantage is mass, 1.0 kg against 2.9 kg per metre, and mass is not a constraint on a structure bolted into the ground, so its one benefit is worth nothing in this application. Steel is also cheaper, easier to weld and repair, and its fatigue behaviour under many small cycles is better understood than aluminium's, which matters because aluminium has no fatigue limit and this bar will see millions of cycles.
The safety factor should be at the top of the range, 4 to 6 rather than 2. The conditions that justify a low factor are absent: the loads are not known, since nothing physically limits how many children use the bar or how hard they swing; the users are children, who cannot assess risk and will use the frame in ways the designer did not intend; and the failure consequence is a fall from 2.2 m onto a surface with several children beneath. Neither maintenance nor inspection can be relied on in a public playground, and corrosion at the ground line will reduce the section over the frame's life. A factor of at least 4, and 6 for members whose failure drops a child, is the defensible choice.
(a) Safety factors are a way to design in contingency to prevent failure from overloading a structure.
• Children swing and drop onto the bar, so dynamic load exceeds static weight ✓
• More than six children may use it, since nothing prevents it ✓
• Adults may use or sit on the frame ✓
• An impact load is far higher than a gradually applied one ✓
• Corrosion reduces the section over the frame's life ✓
• Manufacturing variation in the tube ✓
• Deliberate misuse cannot be excluded in a public playground ✓
Award [1] for each relevant reason identified up to [2 max].
(b) Young's Modulus is the measure of stiffness of a material.
• Young's modulus is the ratio of stress to strain ✓
• It measures how much a material deforms elastically for a given load ✓
• Steel at 210 GPa is about three times stiffer than aluminium at 69 GPa ✓
• With identical geometry the aluminium bar deflects about three times as far ✓
• The steel bar feels more solid under the same group of children ✓
• Both return to shape, since neither is loaded past yield ✓
Award [1] for correctly applying the meaning of Young's modulus and [1] for relating it to the behaviour of the two bars, up to [2 max].
(c) Materials with differing Young's Modulus are chosen for specific applications.
• Strength and stiffness are independent properties describing different things ✓
• Yield strength is the stress at which permanent deformation begins ✓
• Stiffness is how much the material deforms elastically before that point ✓
• Yield strength depends on alloying and heat treatment, which vary widely ✓
• Young's modulus is set by atomic bonding and barely changes with alloying ✓
• An aluminium alloy can match mild steel's strength while remaining a third as stiff ✓
• A strong material is therefore not necessarily a stiff one ✓
Award [1] for each detail, leading to an account of why strength and stiffness differ independently, up to [2 max].
(d) Structures are typically designed with a safety factor in case of overloading, and material selection determines the governing failure mode.
Strength does not separate the tubes:
• 270 MPa against 250 MPa on identical sections ✓
• Strength alone gives no basis for the choice ✓
Stiffness does:
• The aluminium bar deflects roughly three times as far for the same load ✓
• A visibly sagging bar feels unsafe whether or not it is safe ✓
• Children swing rather than hang still, so a springy bar stores and returns energy ✓
• That encourages more vigorous use and raises the dynamic load ✓
Selecting steel:
• Aluminium's advantage is mass, 1.0 kg against 2.9 kg per metre ✓
• Mass is not a constraint on a structure bolted into the ground, so the benefit is worth nothing here ✓
• Steel is cheaper and easier to weld and repair ✓
• Aluminium has no fatigue limit, and the bar will see millions of cycles ✓
Selecting the safety factor:
• The conditions justifying a low factor are absent ✓
• Loads are not known, since nothing limits how many children use it or how hard they swing ✓
• Users are children, who cannot assess risk and will use it unintendedly ✓
• Failure means a fall from 2.2 m with children beneath ✓
• Maintenance and inspection cannot be relied on in a public playground ✓
• Corrosion at the ground line reduces the section over the frame's life ✓
• A factor of at least 4, and 6 where failure drops a child, is defensible ✓
Award [1] for each relevant detail / reason / cause relating to the selection of tube and safety factor up to [4 max]. Award a maximum of [3] where the response addresses only one of the two decisions. Credit responses that identify stiffness rather than strength as the deciding property.
Linking Questions
On the evening of July 17, 1981, two suspended walkways crossing the atrium of the Kansas City Hyatt Regency collapsed onto a crowded event below, killing 114 people. It remains the deadliest structural failure in US history outside of a deliberate attack. The walkways had been open for barely a year.
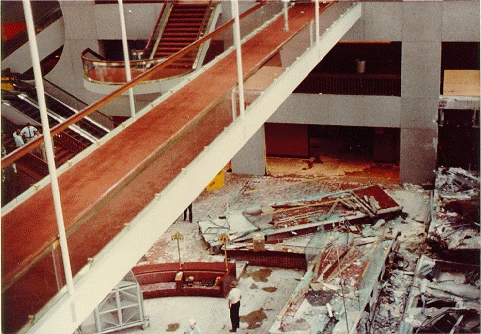
The original design hung both walkways from a single set of steel rods running continuously from the roof, through the fourth-floor walkway, down to the second-floor walkway below it, each floor's box-beam connection carrying only its own walkway's share of that one rod's load. During construction, the steel fabricator found threading and lifting a rod that long impractical and proposed a simpler fix: two separate, shorter rods instead of one continuous one, with the second rod hanging directly off the fourth-floor walkway rather than passing through it. On paper it looked like the same connection repeated twice. In reality, it meant the fourth-floor box beam now had to carry the weight of both walkways instead of just its own, roughly doubling the load on a connection that had almost no spare capacity to begin with. The change was approved without the full recalculation that would have caught it, and on a night when the walkways were packed with spectators, the connection finally gave way. Learn more on Wikipedia.